Data Ingestion and Updation
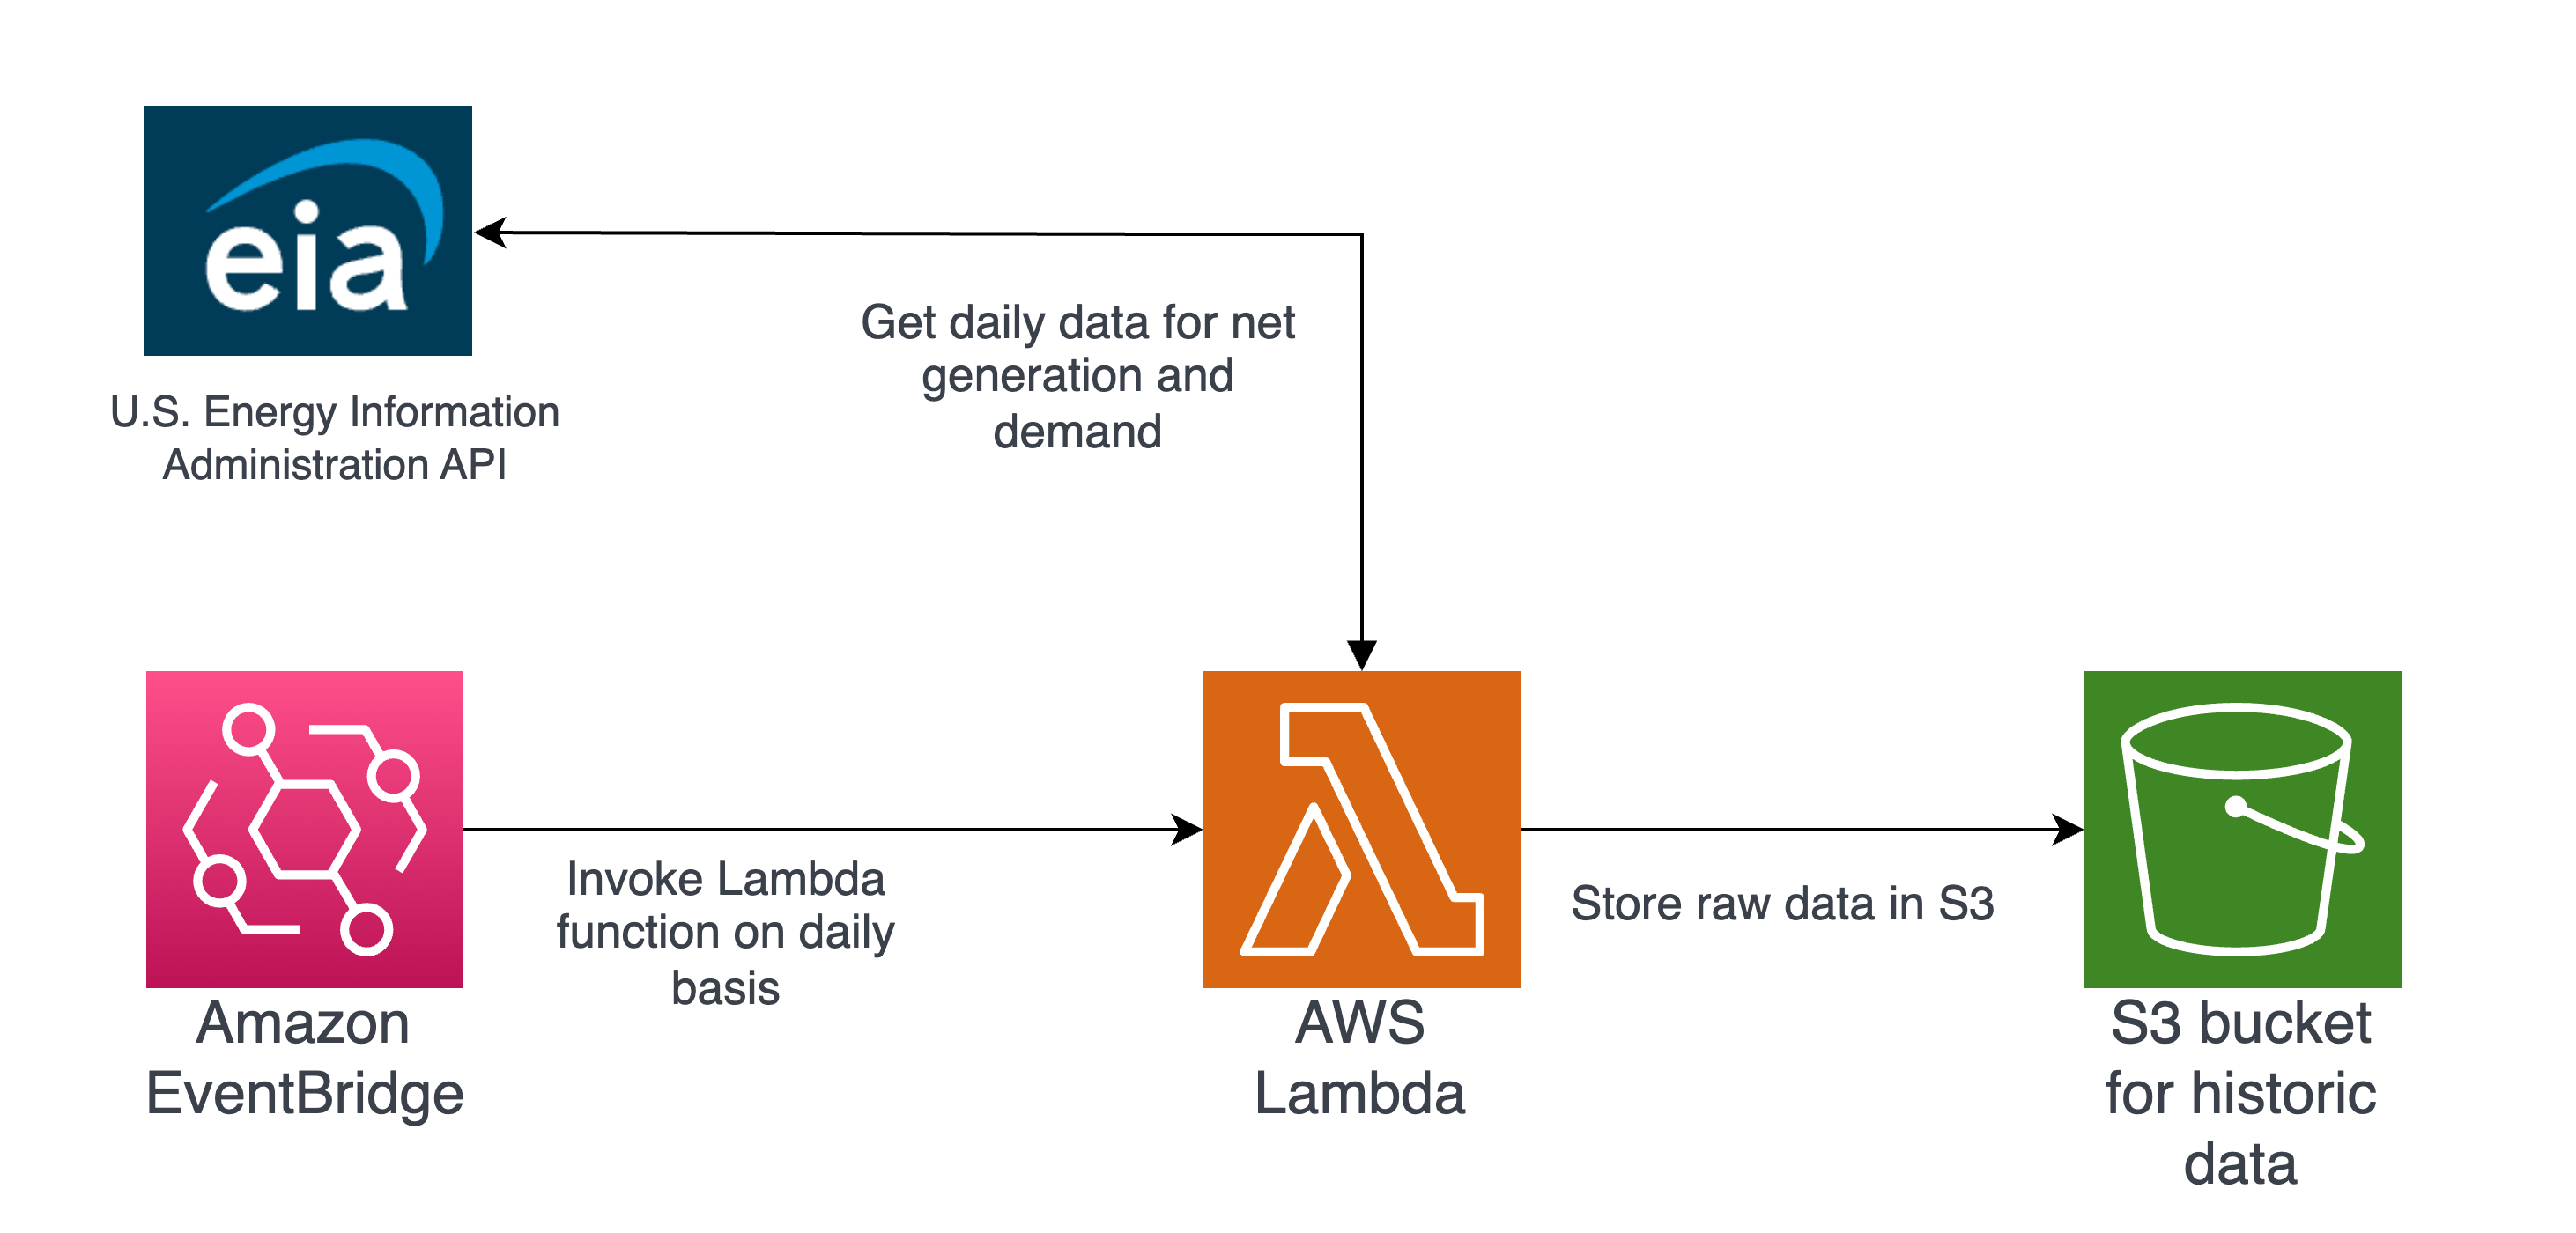
We have successfully implemented and deployed our Data Extraction logic, which involves segmenting historical data by region and storing it in separate parquet files. Our process begins by running a Python script that retrieves data from the EIA API for the last four days, with the fourth day being the previous day when the script is executed.
To ensure data completeness, if any data is missing for the previous day, we fill in the gaps by using the median of the available data for that day. For the remaining three days, where updated values are likely to be present, we update the historical data with the latest information for matching dates and append new data for the previous day (non-matching date).
Once the historical data is updated, we store the region-wise parquet files in our designated S3 bucket. This entire process is automated on AWS using a lambda function called "daily-ingestion," which is triggered by Amazon EventBridge every day at 6:00 am EDT.
Model Retraining & Prediction
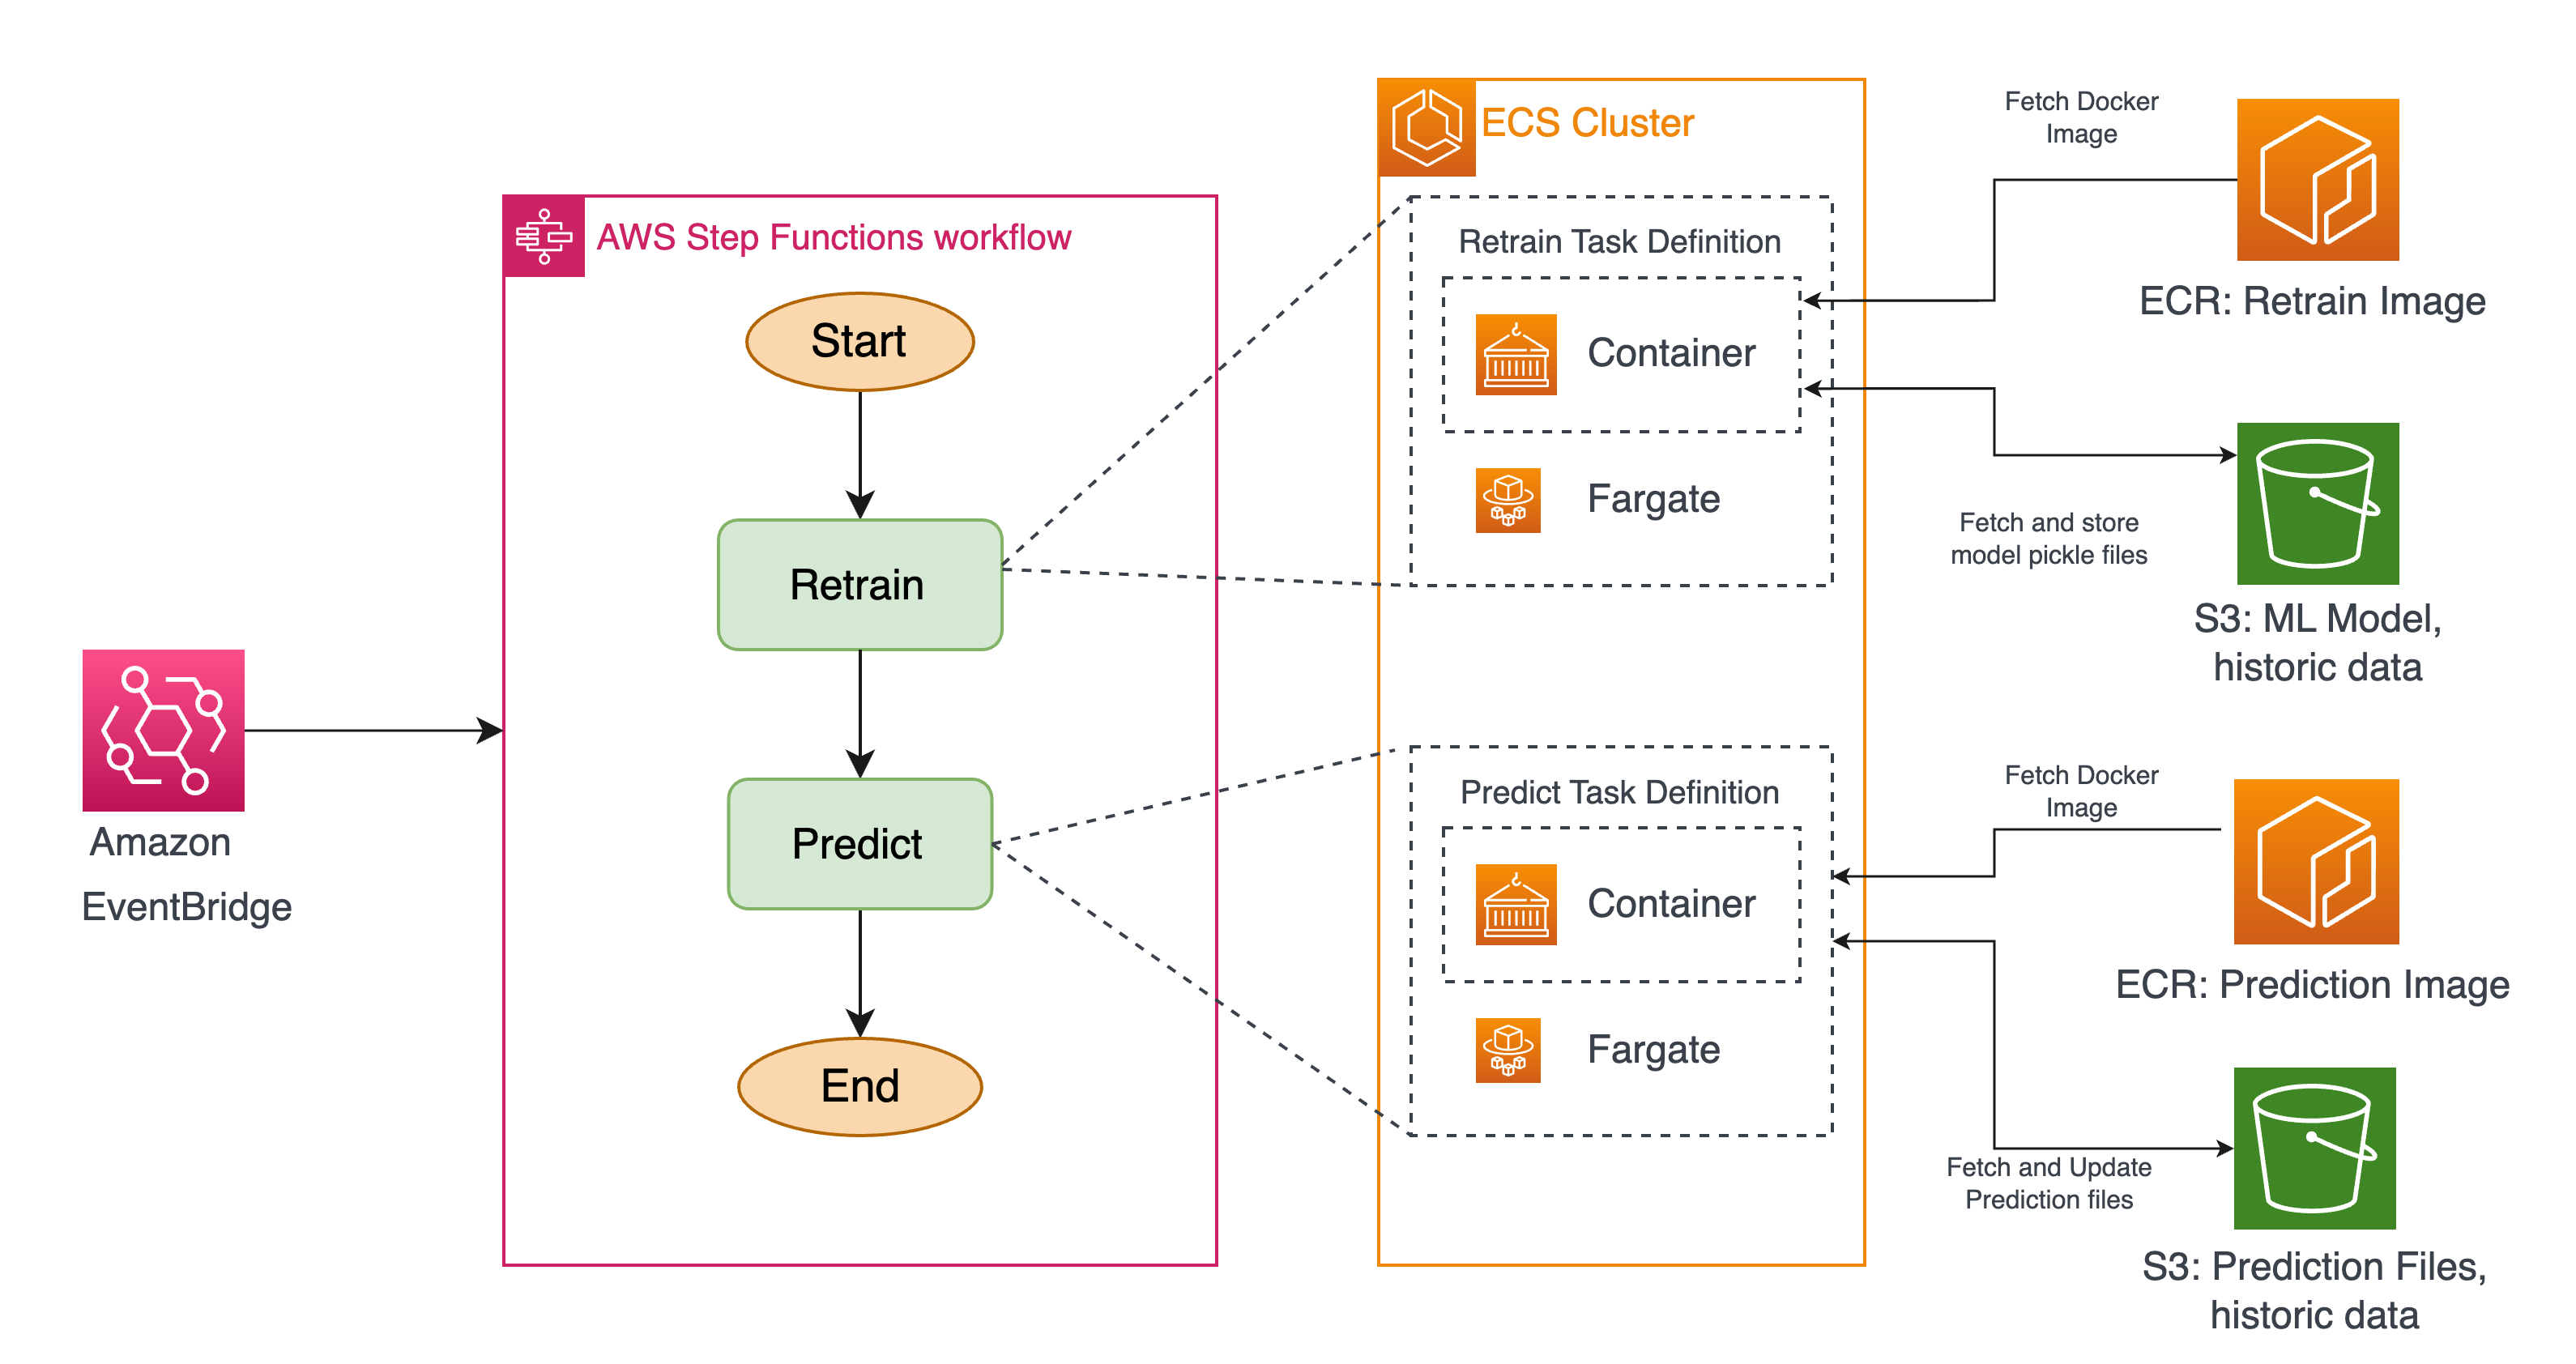
Our automated ML modeling process consists of two main tasks: model retraining and generating predictions. This process runs weekly when new data for the entire week becomes available
To achieve this, we utilize AWS Step Functions as our orchestration tool. Using Step Functions, we create a simple workflow. The workflow begins with the retraining task, which involves running a Docker container in an ECS cluster. This container retrieves updated data from S3, performs model retraining, and stores the updated model files in S3 as pickle files.
Once the model is trained on the new data, the next step is to generate a 1-year forecast. Step Functions triggers another task in ECS to run a Docker container in the ECS cluster. This container generates the new predictions and saves them in the designated S3 bucket.
The entire workflow is scheduled to run automatically every week using Amazon EventBridge.
Frontend Integration
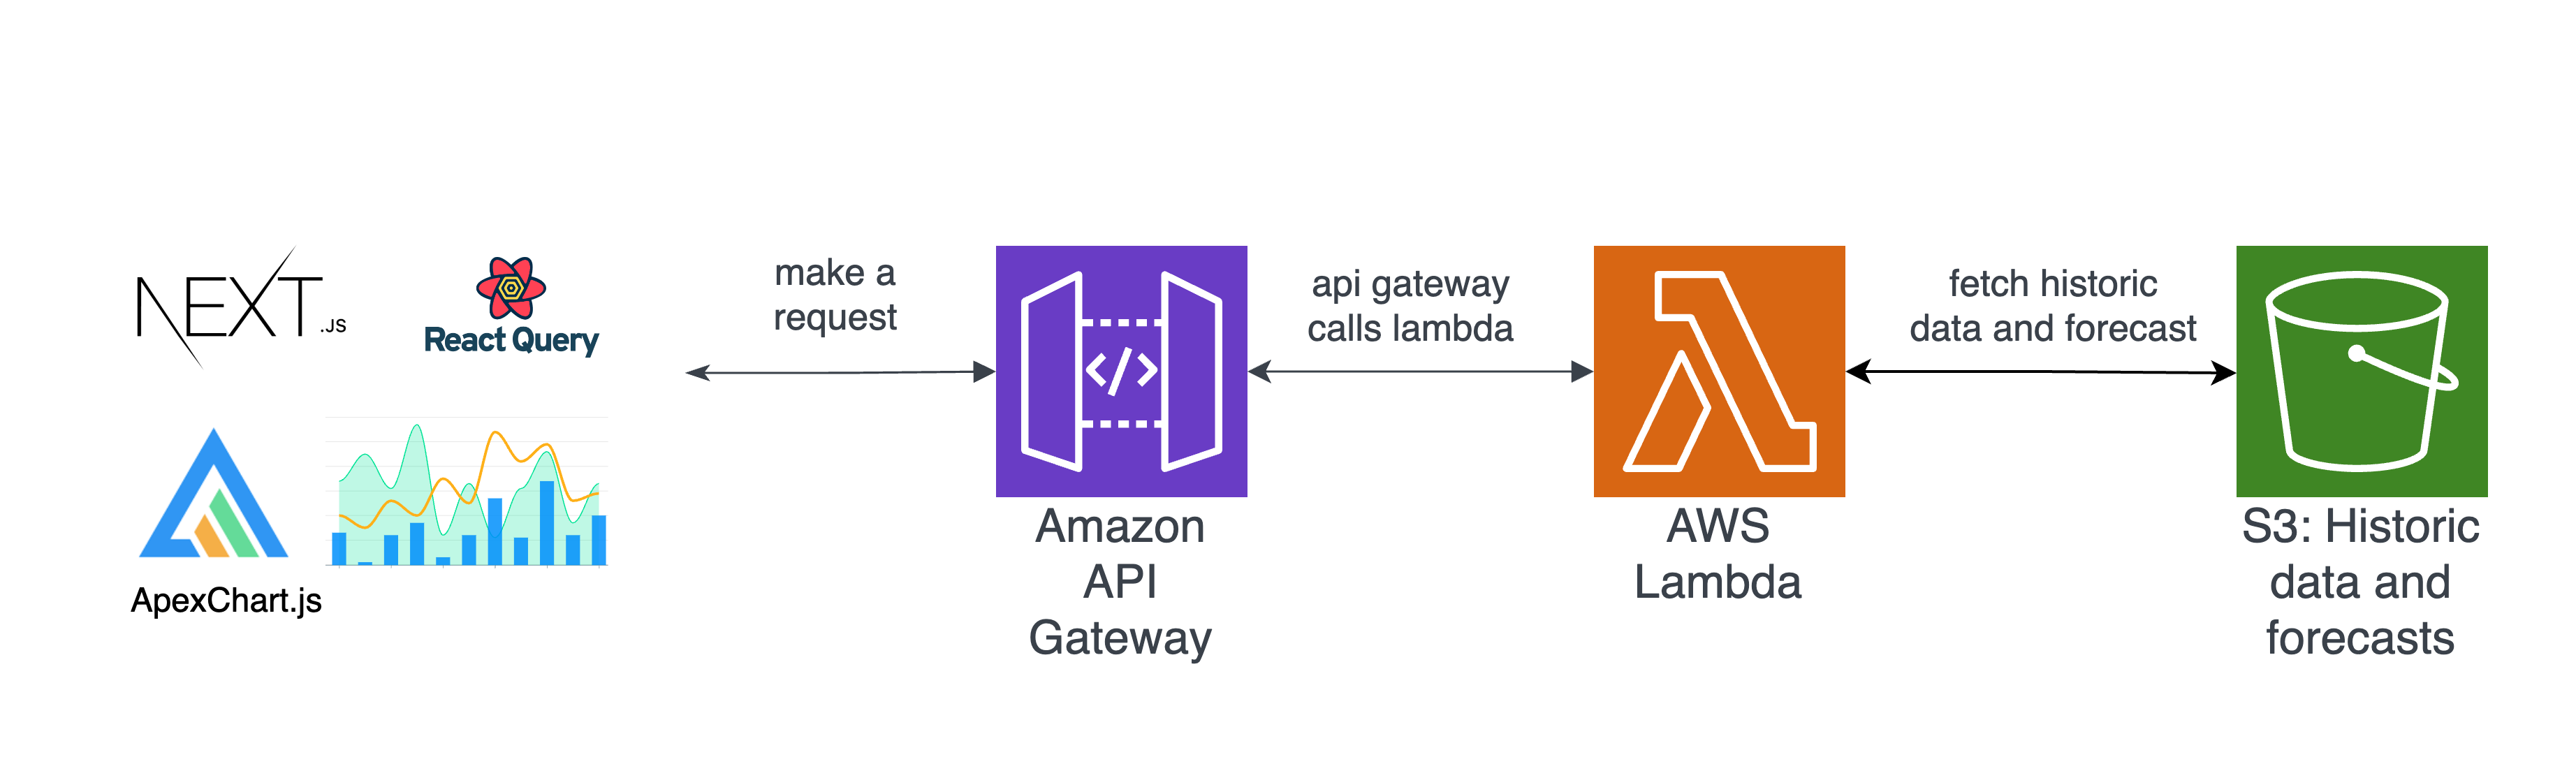
We utilize a combination of technologies for our frontend development. Next.js serves as our frontend framework, ApexCharts.js handles interactive data visualization components, and Material UI is used for CSS styling.
To communicate with our backend, the frontend makes API calls to our AWS API Gateway endpoint. These calls are in the form of HTTP GET requests, accompanied by query parameters. For forecasting purposes, additional parameters such as region, model, frequency, and time are also included.
Upon receiving the request, the API Gateway routes it to the associated Lambda function. The query parameters are proxied to the Lambda function, which fetches the relevant data from the S3 buckets. The Lambda function performs aggregation and filtering based on parameters like region, frequency, time, and model.
The retrieved data is then visualized using ApexCharts.js, which provides chart components with interactive functionalities such as zooming, panning, and data resetting. To optimize performance, we incorporated ReactQuery to cache API responses for 5 minutes, reducing unnecessary API calls when data remains unchanged. The frontend of the project is deployed on Vercel, a cloud platform.